# Load of libraries
library(tidyverse)
library(sp)
library(gganimate)
n_simulations <- 3000
df <- tibble(
values_x = runif(n_simulations,0,1),
values_y = runif(n_simulations,0,1)
)
circleFun <- function(center=c(0,0), diameter=1, npoints=100, start=0, end=2)
{
tt <- seq(start*pi, end*pi, length.out=npoints)
data.frame(x = center[1] + diameter / 2 * cos(tt),
y = center[2] + diameter / 2 * sin(tt))
}
dat <- circleFun(c(0,0), 2, start=1.5, end=2.5)
df <- df %>%
rowwise() %>%
mutate(label = point.in.polygon(values_x, values_y, dat$x, dat$y, mode.checked=FALSE)) %>%
ungroup() %>%
mutate(count_in = cumsum(label),
id = row_number(),
pi_value = 4*(count_in / id))ggplot(df) +
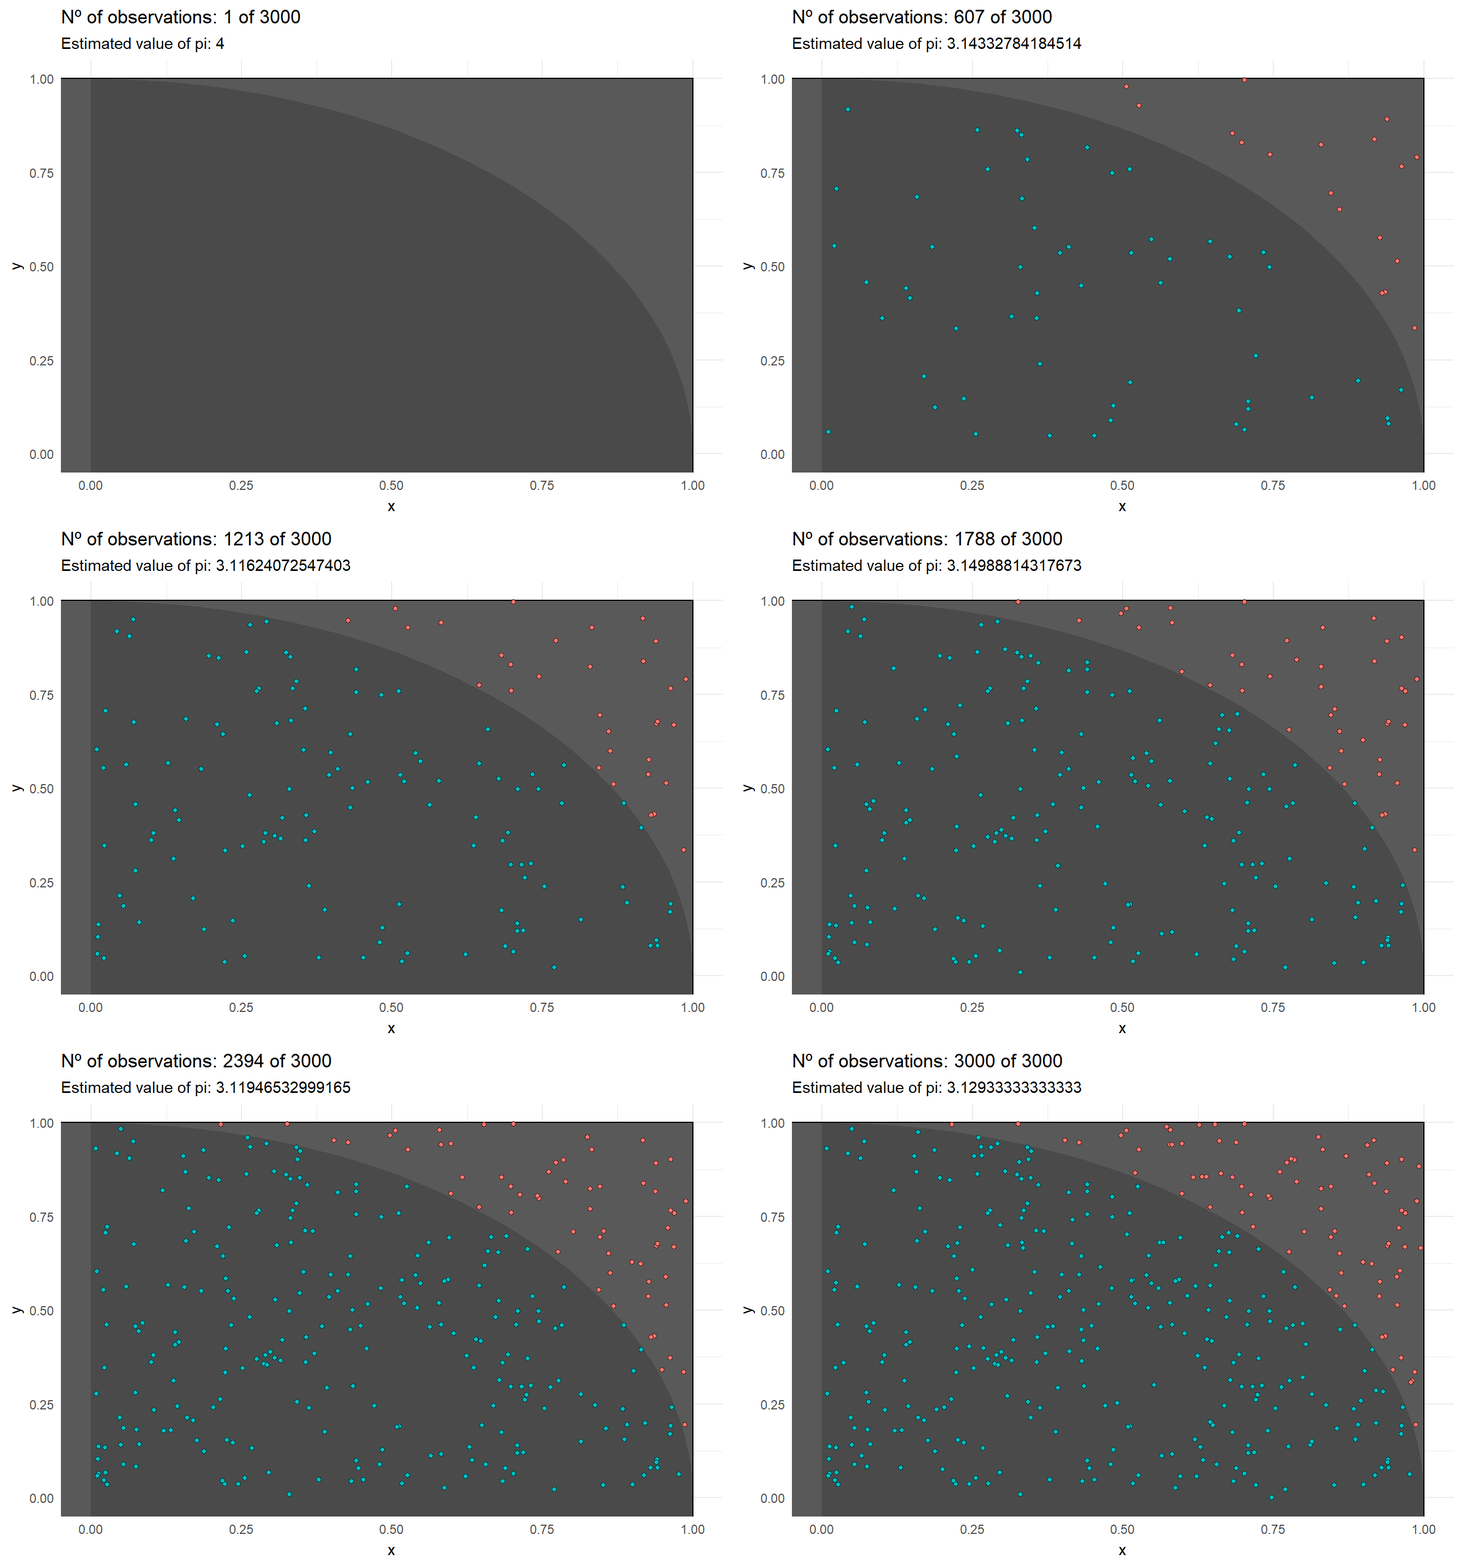
geom_rect(aes(xmin = -1, xmax = 1, ymin = -1, ymax = 1),
colour = "black", show.legend = FALSE) +
geom_polygon(aes(x, y), data = dat, alpha = 0.4) +
geom_point(aes(x = values_x, y = values_y, fill = factor(label), group=id),
color = 'black', shape = 21, show.legend = FALSE) +
theme_minimal() +
coord_cartesian(ylim=c(0, 1), xlim = c(0,1)) +
transition_reveal(id) +
labs(title = 'Nº of observations: {frame_along} of {n_simulations}',
subtitle = 'Estimated value of pi: {df$pi_value[as.integer(frame_along)]}')
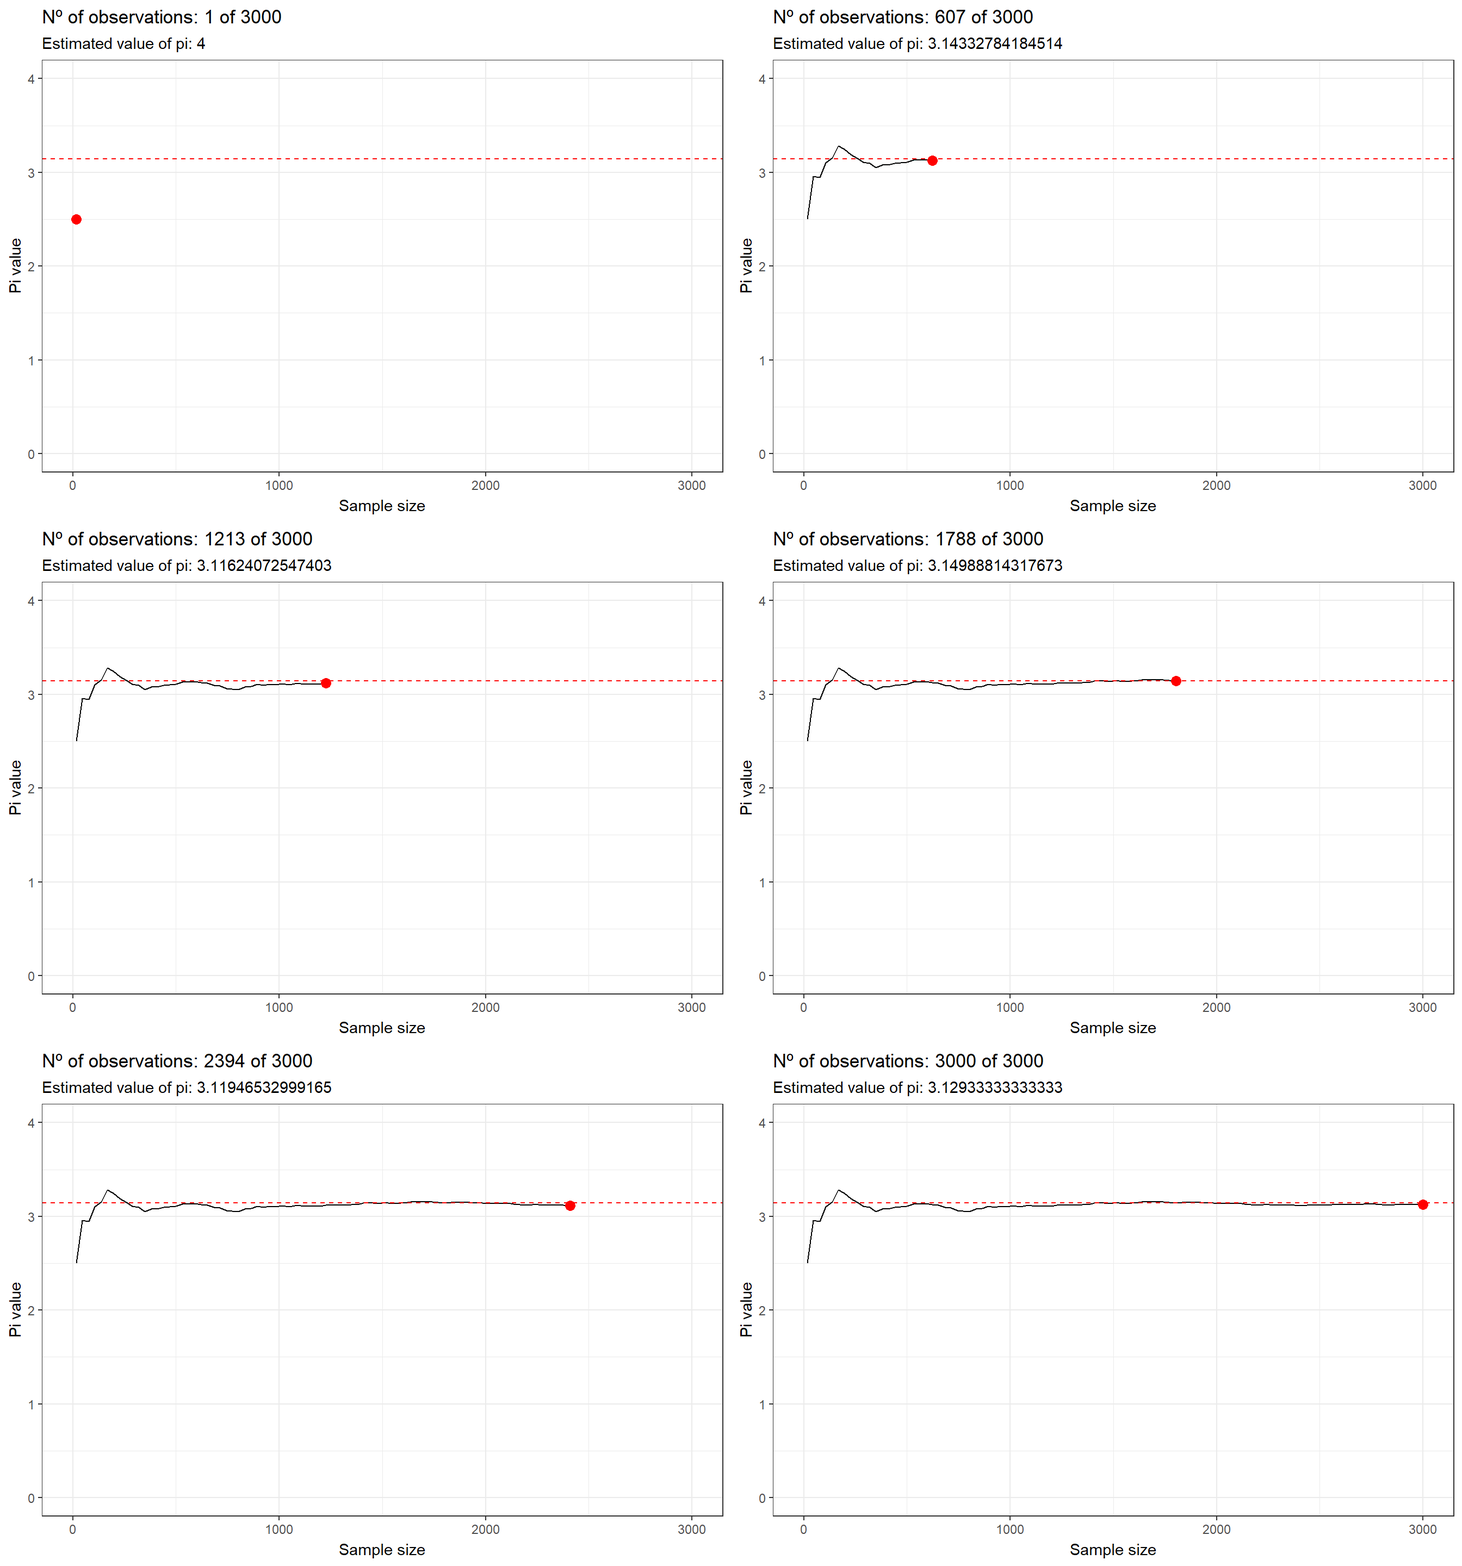
ggplot(df, aes(id, pi_value)) +
  geom_line() +
  geom_point(colour = 'red', size = 3) +
  transition_reveal(id) +
  geom_hline(yintercept = pi, color = 'red', linetype= 'dashed') +
  theme_bw() +
  labs(title = 'Nº of observations: {frame_along} of {n_simulations}',
       subtitle = 'Estimated value of pi: {df$pi_value[as.integer(frame_along)]}',
       x = 'Sample size',
       y = 'Pi value') +
coord_cartesian(ylim=c(0, 4)) 